Do you like having things under control? Atlassian provides many options to help you with planning, processes, and project performance evaluation. This process also includes reporting. We can create Dashboards in Jira, add some fancy Gadgets, and enjoy the feeling of having everything under control. But we might run into a problem: the portfolio of available Gadgets is limited. What if we cannot find the one we need? Does it mean we need to make a compromise between what we need and what the available options are? No – in that case, PocketQuery enters the stage 🌟!
What is PocketQuery?
PocketQuery is a tool that helps you to access any datasource directly from your Confluence. You can create Queries that extract data from external datasources, convert the data using Converters, and finally visualize it using Templates.
Create reports of anything!
Do you have a clear idea of what you want your Report to look like? Perfect! PocketQuery will help you make your idea real! All you need to do is create a JQL query that returns all the relevant issues. Now, we can set up a datasource that will execute your JQL query. Once you have a query result, you can transform it into anything you want… And you can visualize this anything the way you want. Do you prefer bar chart, pie chart, area chart, bubble chart, or something fully custom? With Google Charts, the range of options is nearly unlimited - be creative and impress your colleagues with stunning charts!
Ok, but how does it work?
Let’s look at a usage scenario of PocketQuery charts. Consider a Jira project with 5 components: Page, Project, Gadget, Report, and Space. For each of these components, there is a different person responsible for keeping it in a good shape. Each issue we create in this project has one or more components. We want to see the amount of open tasks for each of these components in a bar chart, so we can trace the workload of our colleagues. Complicated? No, we can do it in 4 steps!
Creating a Jira Datasource
At first, we need to be able to connect to Jira. Create a new Datasource, we call it Jira Datasource. We want to access Jira using its REST API, so we select the Rest Basic Auth Datasource type. Make sure you also insert your username and valid REST API token into password field (How do I generate a REST API token?).
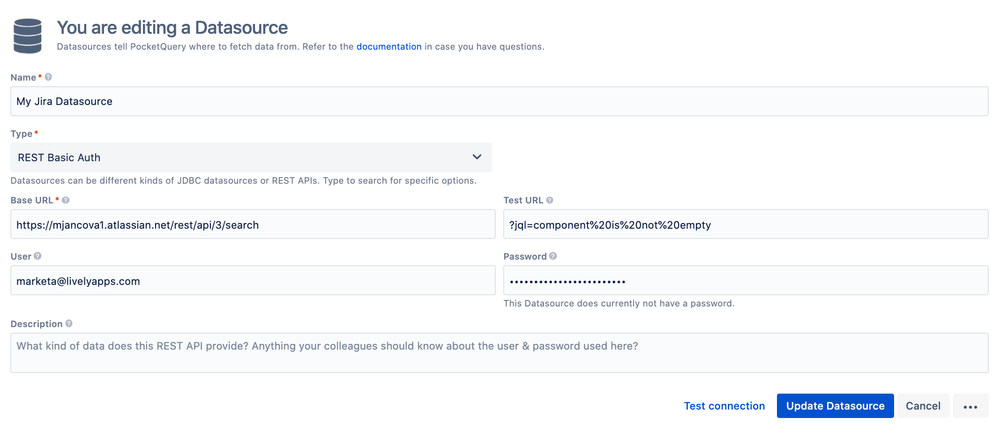
You can test your connection by inserting a Test URL value, for example ?jql=component%20is%20not%20empty. Then, click Test Connection and make sure that you were successfully authenticated to your Jira. Seeing a green message? Congratulations, you’ve finished the first step 🎉!
Querying the Jira Datasource
Now we are ready to create our first Query. Let’s call it Jira Component Query and configure it as follows:
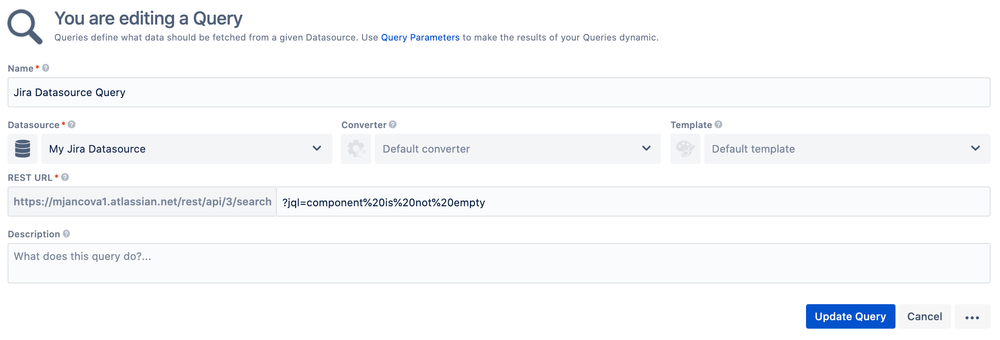
Don’t forget to specify your JQL function! For now, you can keep the default values for Converter and Template fields. Let’s execute it!
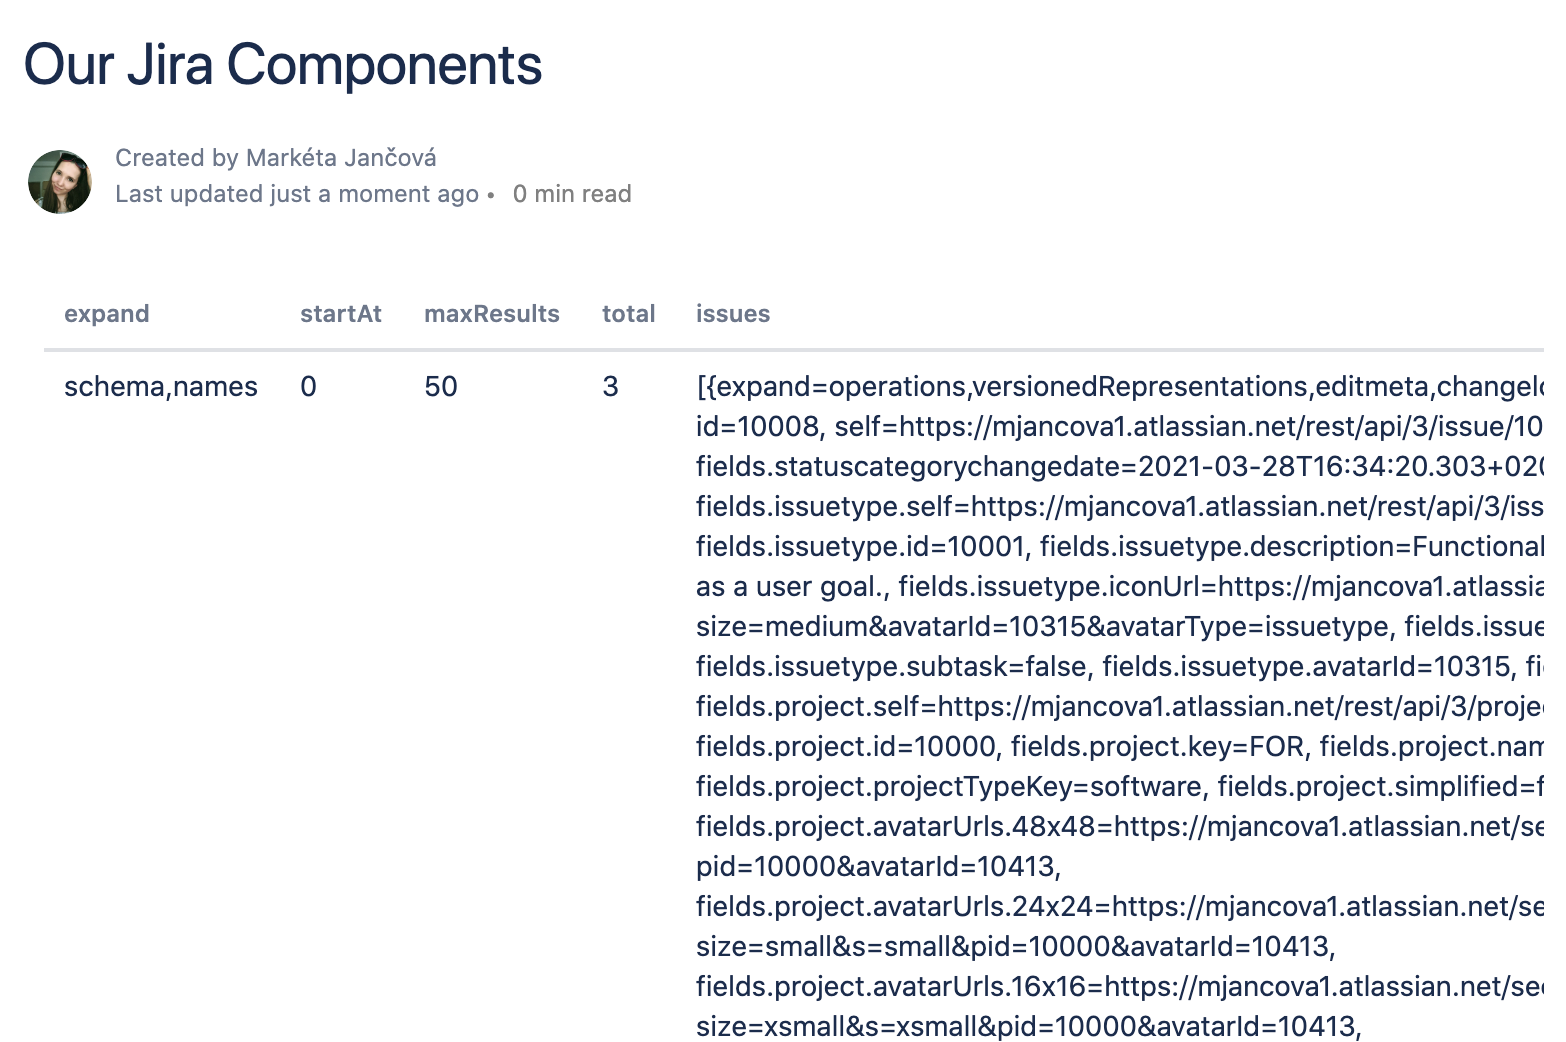
Eh, that could look a bit prettier, right 😓? We cannot see much here right now… Let’s see what a Converter can do for us!
Converting Results
At this point, we are able to obtain our issues but the result contains a lot of redundant details. Converters help us to get rid of these! To write a proper Converter, we need to understand the structure of our JSON result (obtained from the datasource). After we format the result to a human-readable form, we can see the following:
Our components are concealed deep down in a complicated JSON object. Let’s unwrap it to access issue components: we need to obtain the issues.fields.components property.
Once we have the results in the following format:
we will count the number of occurrences for each component in the array. It might sound a bit complicated but we can do it in few lines of code:
This piece of code returns exactly what we need! But it looks a bit complex, doesn’t it? Let’s see what it does…
At line 4, we iterate over all issues and extract their component property. We don’t need other issue details. As the result, the issueComponents variable has the following structure: [{id: "10002", name: "Page"}, {id: "10003", name: "Space"}, ...].
At line 6, we want to pick all component names in order to know which (unique) components we have. Afterwards, the componentArray contains a list of names that looks like: ["Page", "Space", ...].
At line 10, we arrange the obtained data into the required structure. The target format is [{Name: "Page", Count: 2}, {Name: "Space", Count: 1}, ...]. We need to iterate over all components in the componentArray and construct a new array that contains only unique occurrences and the number of these occurrences. For each component, we decide whether we already have it in our unique array (line 11). If so, we increase the counter of the element (lines 13 and 14). If not, we add it and set counter to the initial value (line 16).
At line 20, we only return the result.
And that’s quite it! It does not look that complicated anymore, right? Now, we can move to the last step. Let’s make it look pretty!
Introducing a Template
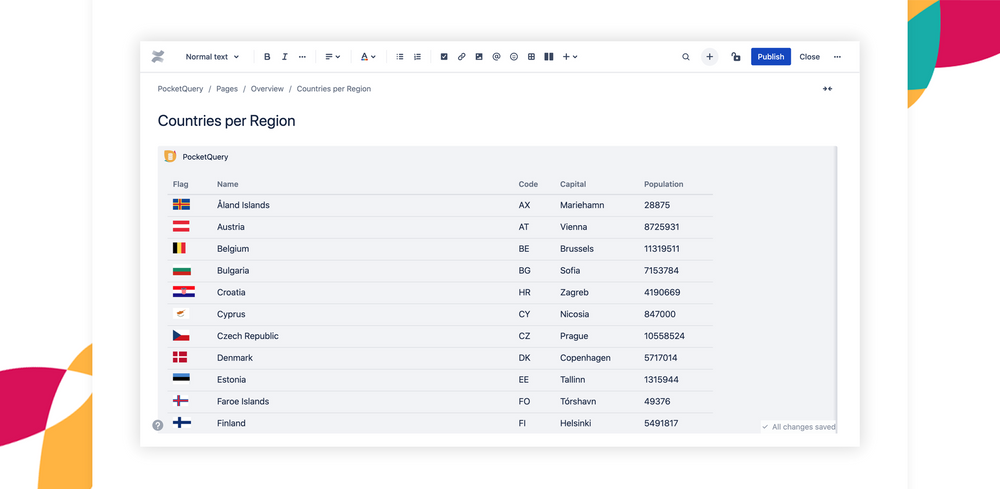
The last part we need is to visualize our results. Let’s look at what we have so far.
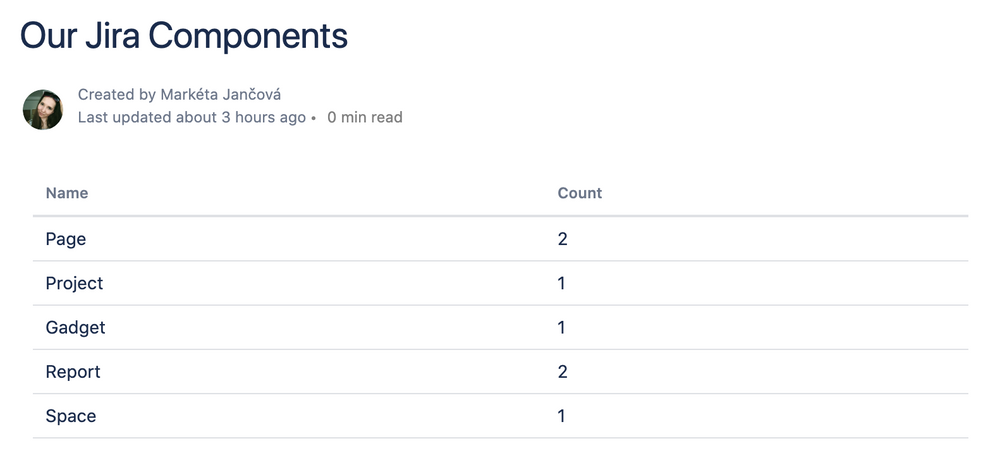
This looks quite good already, doesn’t it? The default template shows the results in an organized table. But we can make it smoother in a few seconds!
Let’s create a template called Jira Datasource Template. All we need in the template is the following piece of code:
How does it look like now?
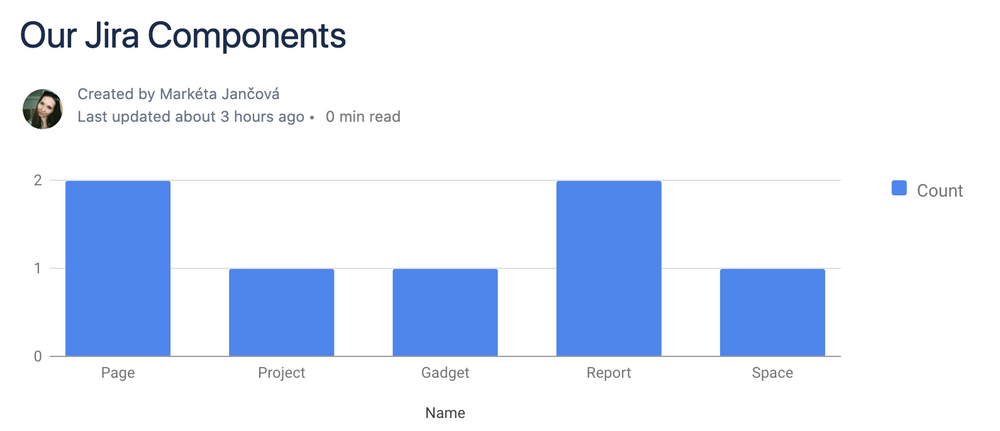
Almost perfect 📈! But we prefer green instead of blue… and we prefer horizontal bar chart instead of vertical:
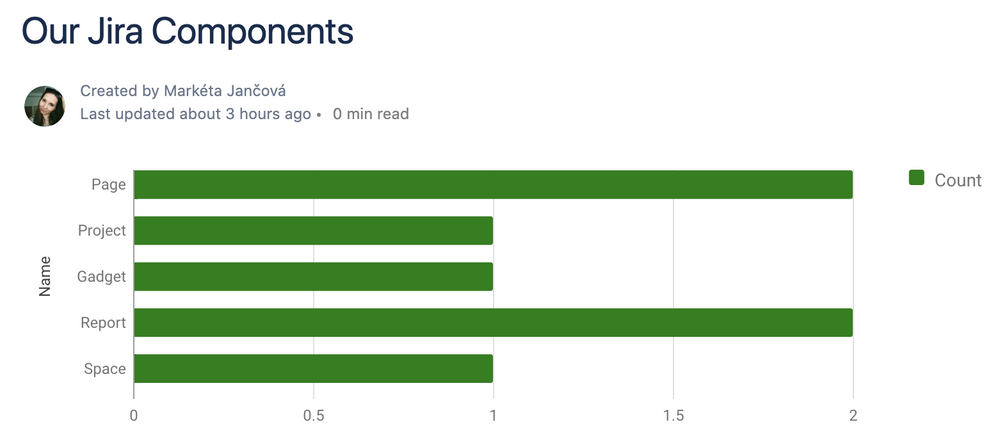
Our chart is now ready! It is refreshed every time you load the page, so you can be sure that it is always up to date 🚀!
Still looks too complicated? Don’t worry, we prepared tutorials to help you start off: PocketQuery Converters and PocketQuery Templates!
Try it for free!
And now it’s your turn! Build a stunning chart and create a perfect integration between your Jira and Confluence. Try PocketQuery for Confluence Cloud for free! You can find it on the Atlassian Marketplace. Having issues? Questions? Feedback? Don’t hesitate to contact Lively Apps Support – we are here for you!

.png)


.png)