Imagine you are approaching a new Confluence space and you find hundreds of pages, contributors, and comments; everything seems unorganized; lots of content. You take a sip out of your coffee and ask yourself: “Okay, what is actually going on here?” and then start tediously browsing through all pages one by one… But you can do better! Let us introduce our brand new app: Usage Statistics for Confluence (which happens to be the second Forge app on the Atlassian Marketplace) 🥈.
A few days ago, we shared some great news with you: Forge went live and we introduced our app Link Management for Confluence Cloud – the first app on Atlassian Marketplace implemented in Forge. That was a great success, which deserved a proper celebration 🍻. However, it did not slow us down! We drank a bit more coffee and went ahead to aim for another success - the second Forge app on the Atlassian Marketplace 🎉! We are excited to tell you more about the app and show you how it can improve your Confluence Cloud experience.
How many pages? Who contributed? Who commented? See it all!
Usage Statistics for Confluence gives you access to a Space Summary via the sidebar. There you can see a lot of useful information, such as what pages your team is working on right now, the most recent comments, the most liked pages, and much more. Your whole space is analyzed based on 16 metrics and each of these metrics then represents one cell in the overview. Specifically, you can find the following information there
- Number of pages
- Number of blog posts
- Number of attachments
- Most recently edited pages
- Dustiest pages
- Latest comments
- Top contributors
- Attachment types
- Biggest attachments
- Content created in the last six months
- Content growth over the last six months
- Most used labels
- Most active content
- Most popular content
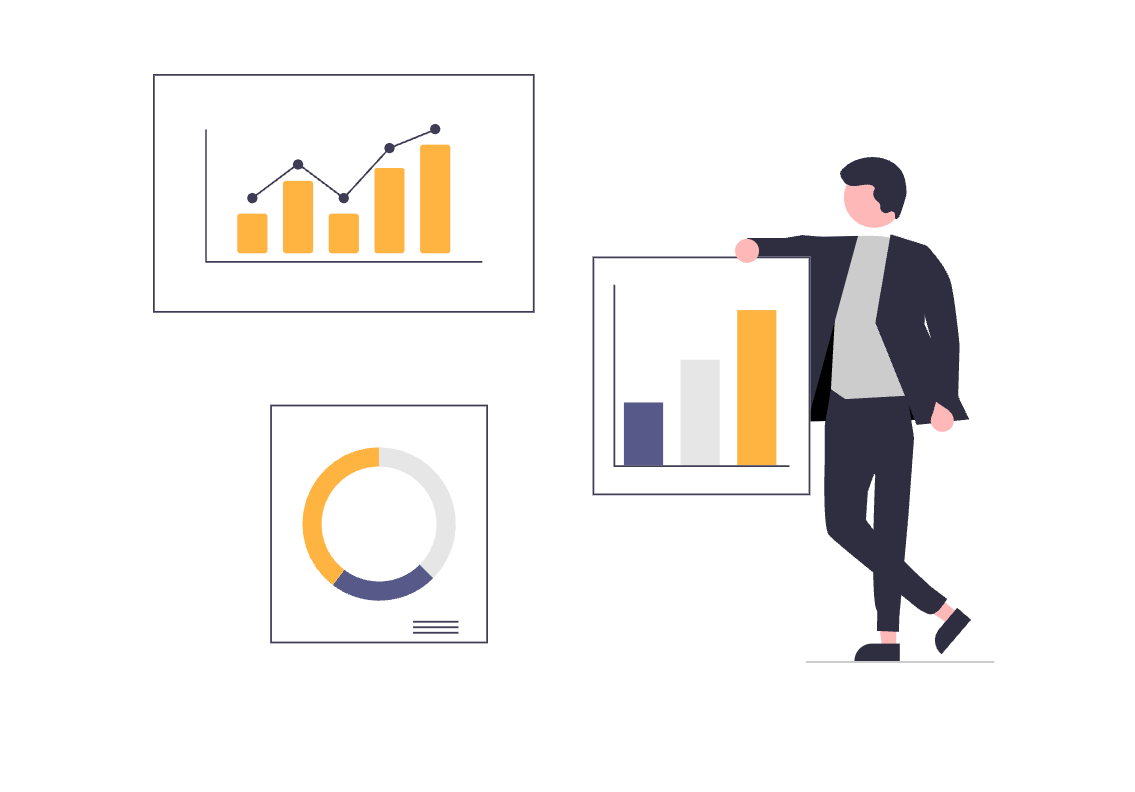
Eh, that’s quite a lot, right? Nobody needs another complicated analytics tool with tons of details and numbers! We have enough of them in our Jira reports 🙊… But let’s give it a try: what does the result look like?

No worries 🕶️! Clean and organized! The massive size of a Confluence space won’t scare you again! Catching up with Confluence space content can be easy.
And now try it yourself! You can see all the metrics in a single dashboard under the Space Summary tab in your Confluence Space.
How can I install Usage Statistics for FREE?
Usage Statistics for Confluence is available on the Atlassian Marketplace. And it is completely free!
If you have any questions, you can reach out to us at any time using our Service Desk portal. We are also happy to hear any feedback from you – do you have any ideas, needs, comments? Share them with us, we will listen to you and appreciate all kinds of feedback!

.png)
.png)
.png)


.png)